C++ APP Profiling using Kcachegrind
通过工具Valgrind和Kcachegrind,图形化显示函数调用关系和时间占比 link
1. 安装
sudo apt-get install valgrind kcachegrind graphviz
2. 使用
valgrind --tool=callgrind program [program_options]
kcachegrind callgrind.out.XXX  # open the outputed file
3. 分析
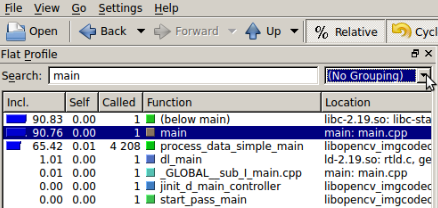
左边界面,列出所有函数,可以搜索特定函数名:
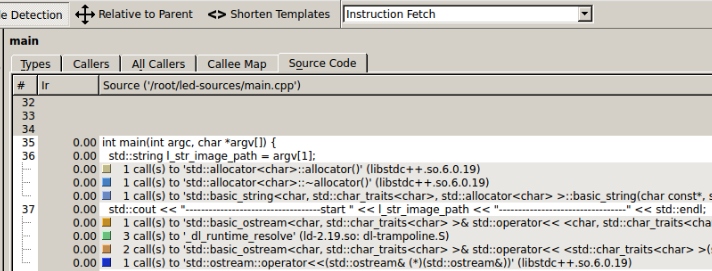
右上部界面,有如下域:
- Types : Present the types of events that have been recorded. In our case, it’s not really interesting, it’s just the number of instructions fetch
- Callers : List of the direct callers
- All Callers : List of all the callers, it seems the callers and the callers of the callers
- Callee Map : A map of the callee, personally, I do not really understand this view, but it’s a kind of call graph representing the cost of the functions
- Source code : The source code of the function if the application has been compiled with the debug symbol(编译-g)
右下部界面,有如下域:
- Callees : The direct callees of the function
- Call Graph : The call graph from the function to the end
- All Callees : All the callees and the callees of the callees
- Caller Map : The map of the caller, again not really understandable for me
- Machine Code : The machine code of the function if the application has been profiled with –dump-instr=yes option
